
Inspect Data allows a user to inspect the underlying data used by a WebReports Visualize. The VisualizeRawData setting in the installation’s appsettings.json controls whether this option is available.
Enable it when users need to examine the data behind a visualization. Disable it when the reporting experience should not provide that inspection option. This controls the Inspect Data feature; it does not replace report access controls or database security.
This setting is edited on the server in appsettings.json, rather than on the Configuration Settings page.
Before you begin
- Obtain authorized access to the WebReports installation directory and permission to edit appsettings.json.
- Back up the file.
- Identify a report containing a Visualize so you can verify the result.
Set VisualizeRawData
- Open the WebReports installation’s
appsettings.jsonin a text editor. - Locate the existing
VisualizeRawDataproperty. Do not create a duplicate. - Set its JSON boolean value to
trueto enable Inspect Data, orfalseto disable it. - Preserve the surrounding JSON structure and save the file.
Enabled:
"VisualizeRawData": trueDisabled:
"VisualizeRawData": falseThese are individual property examples, not complete appsettings.json files. Preserve any comma required by the property’s position in the existing JSON object.
Open Inspect Data in WebReports
- Open the report list in WebReports and select a report that includes a Visualize.
- Choose Run report → Visualize, complete any required parameters, and run the report.
- Move the pointer over an individual chart to reveal its toolbar.
- At the upper-right of the chart, select Inspect Data. Its icon shows a list with a magnifying glass and is located between Export To and Maximize in the chart toolbar.
Screenshot context: These captures show a Sample report in WebReports with the dashboard in full-screen mode. Report fields and values vary by report. Select an image to view it at full size.
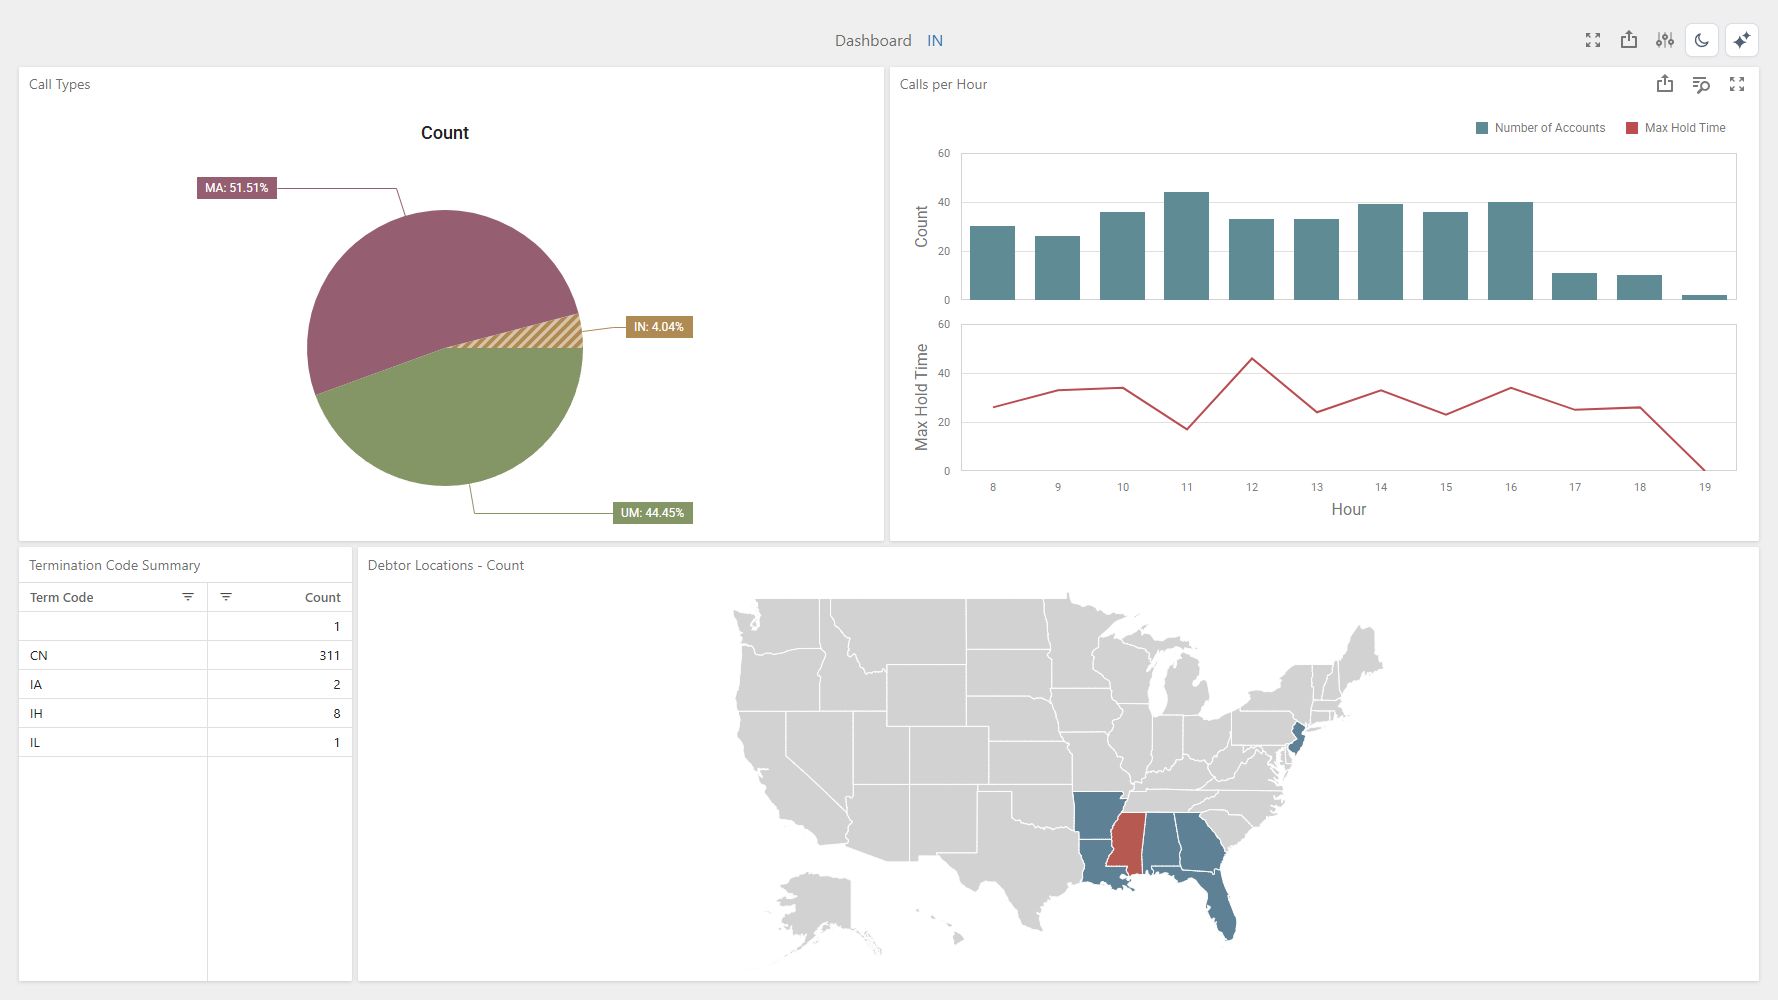
Move the pointer over a chart to reveal its item toolbar. Inspect Data is the list-and-magnifying-glass icon between Export To and Maximize.
Selecting Inspect Data opens a data window for that chart. When both options are available:
- Aggregated displays the summarized values used by the chart.
- Raw displays the underlying records for the dashboard item.
The available options depend on the configuration. Select Close to return to the dashboard.
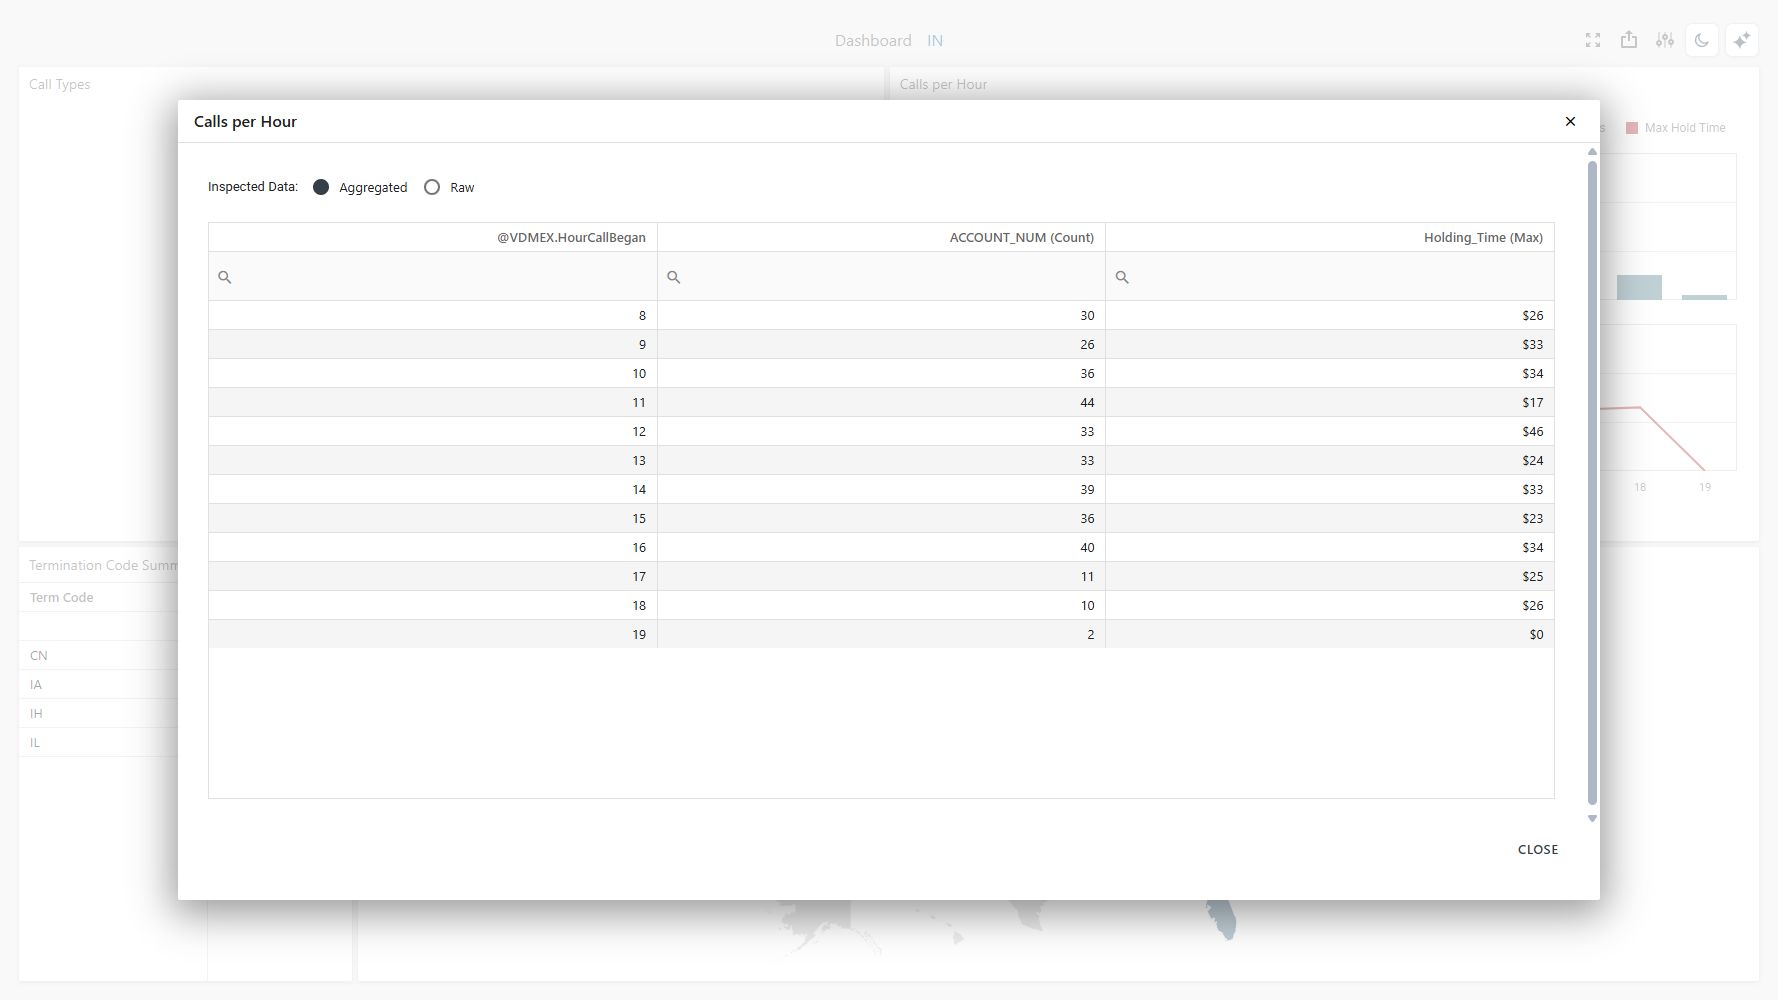
The Inspect Data window for Calls per Hour, showing Aggregated values and the available Raw option.
If the Inspect Data button is unavailable, verify the intended VisualizeRawData setting and that the running WebReports instance has picked up the configuration change.
Verify the result
- Open WebReports and run a report that contains a Visualize.
- Move the pointer over an individual chart and check whether Inspect Data is available in its upper-right toolbar. With
VisualizeRawDataset totrue, select the button and confirm that the data window opens. With the value set tofalse, confirm that the option is unavailable. - If the result does not match the value, confirm that the correct installation file was saved and that there is only one VisualizeRawData property. Consult the deployment administrator if the running instance has not picked up the configuration change.
If WebReports fails to start after the edit, validate the JSON syntax and restore the backup if necessary. Contact BridgeWorks Support if the issue continues. Avoid assuming that a particular restart procedure applies to every deployment.
Comments
0 comments
Please sign in to leave a comment.